Integrating Slack into a SOC Lab: Turning Security Alerts into Real-Time Operational Signals
In a Security Operations Center, alerts are useless if they arrive too late, in the wrong place, or in a form that no human being can realistically parse. One of the most common mistakes in early SOC labs is assuming that dashboards alone are enough. They are not. Dashboards are great for analysis, trends, and investigations, but alerts need to interrupt you. That interruption must be immediate, intentional, and meaningful.
This is why I decided to integrate Slack into my SOC lab. Even though this is a private lab and the Slack channel has only one member, the purpose is not collaboration. The purpose is signal separation. Slack becomes the place where only events that matter arrive, while everything else stays where it belongs: in logs and dashboards.
Integrating the Slack webhook into the security server (Wazuh → Slack)
The first and most important architectural decision is where the Slack integration lives.
Slack is not integrated into Suricata. It is not integrated on endpoints. The integration happens exclusively on the Wazuh manager.
This is non-negotiable for a clean SOC design.
Wazuh is the component that performs correlation, applies detection logic, evaluates severity, and decides whether an event is worth escalating. Suricata generates signals, but it does not make decisions. Slack must receive decisions, not raw telemetry.
From a technical standpoint, the integration is configured inside the Wazuh main configuration file:
/var/ossec/etc/ossec.conf
Inside this file, I added a dedicated <integration> section to enable Slack notifications:
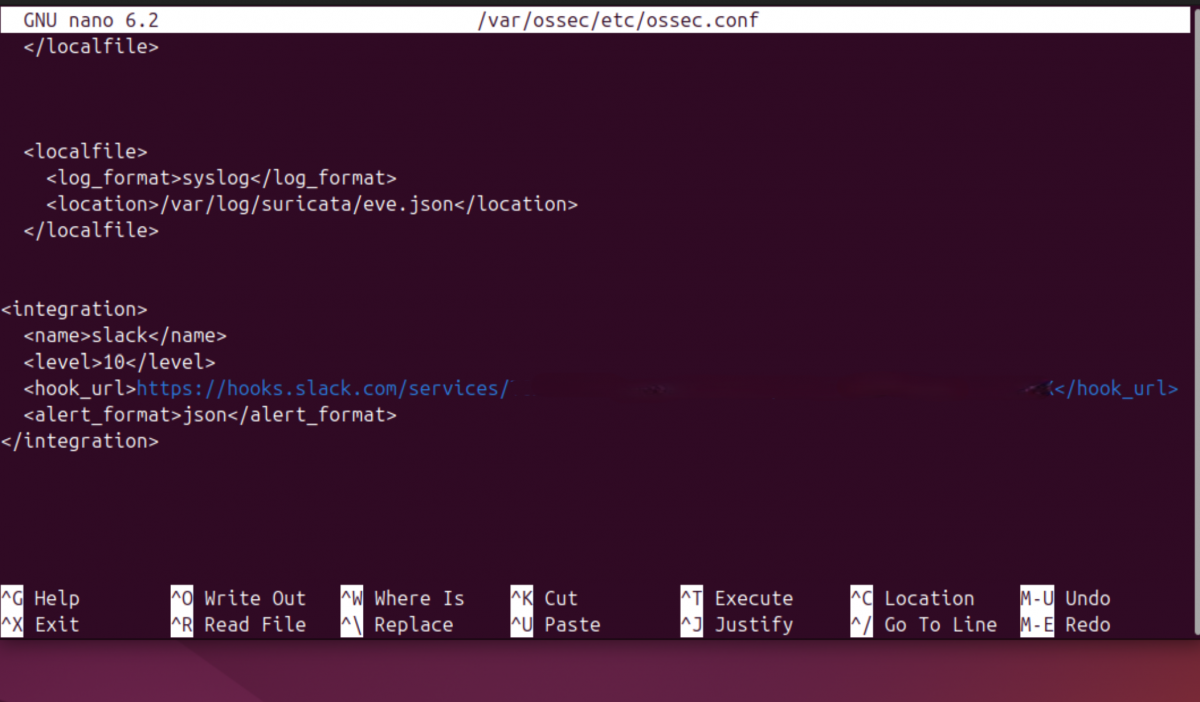
Each element here has a precise role. Declaringslack 10 directive is critical: it ensures that only alerts with a Wazuh rule level equal to or higher than 10 are forwarded to Slack. Everything below that threshold is silently ignored. The JSON format is mandatory, because the Slack integration script operates on structured alert data.
After saving the configuration, the Wazuh manager must be restarted:
sudo systemctl restart wazuh-manager
To verify that the integration has been loaded correctly, I always monitor the Wazuh logs:
sudo tail -f /var/ossec/logs/ossec.log | grep integratord
A correct setup produces a clear confirmation message indicating that the Slack integration has been enabled.
Before moving forward, however, there is a mandatory validation step that should never be skipped: testing the webhook manually. A simple HTTP POST confirms that Slack is reachable and properly configured:
curl -X POST \
-H 'Content-type: application/json' \
--data '{"text":"Slack webhook test from SOC lab"}' \
https://hooks.slack.com/services/XXXXXXXXX/XXXXXXXXX/XXXXXXXXXXXXXXXX
If this test fails, nothing else will work. Period.
Reducing noise: tuning rules from Suricata to Wazuh
Once Slack integration is active, the next problem becomes immediately apparent: noise.
Suricata is intentionally verbose. It flags informational traffic, benign DNS lookups, update mechanisms, and protocol oddities. This is expected behavior for an IDS, but it is unacceptable for real-time alerting.
The goal is simple: only events that deserve immediate human attention should reach Slack.
Suricata assigns a severity value to each alert:
1 for high severity
2 for medium-high severity
3 for informational events
Wazuh, on the other hand, uses rule levels from 0 to 15. The bridge between these two systems is built inside Wazuh’s local rules file:
/var/ossec/etc/rules/local_rules.xml
Instead of filtering alerts inside Suricata, I let Suricata generate everything and use Wazuh to decide what matters. The strategy is to intercept Suricata alerts using the base Suricata rule (if_sid 86601), inspect the native JSON field data.alert.severity, and promote only severity 1 and 2 events to a high Wazuh rule level.
The custom rules look like this:

This approach creates a clean separation of responsibilities. Severity 3 alerts remain visible in dashboards and logs but never reach Slack. Severity 1 and 2 alerts are elevated, assigned a rule level that exceeds the Slack threshold, and forwarded immediately.
After adding the rules, the manager must be restarted:
sudo systemctl restart wazuh-manager
Rule loading can be verified directly from the logs:
sudo tail -f /var/ossec/logs/ossec.log | grep "rules loaded"
At this point, the alert volume drops dramatically, and Slack becomes quiet. That silence is intentional.
Making Slack alerts human-readable (custom slack.py)
Even with noise under control, there is one final problem: format.
By default, Wazuh sends the full_log field to Slack. Technically complete, operationally useless. Reading raw JSON during an incident is not analysis; it is self-inflicted pain.
The solution is to customize the Slack integration script:
/var/ossec/integrations/slack.py
Inside the generate_msg() method, I replaced the default behavior with logic that extracts only meaningful fields from the Suricata alert payload. Instead of dumping JSON, the script builds a structured, readable message.
The transformation replaces this:
msg['text'] = alert.get('full_log')
with a custom SOC-friendly format:
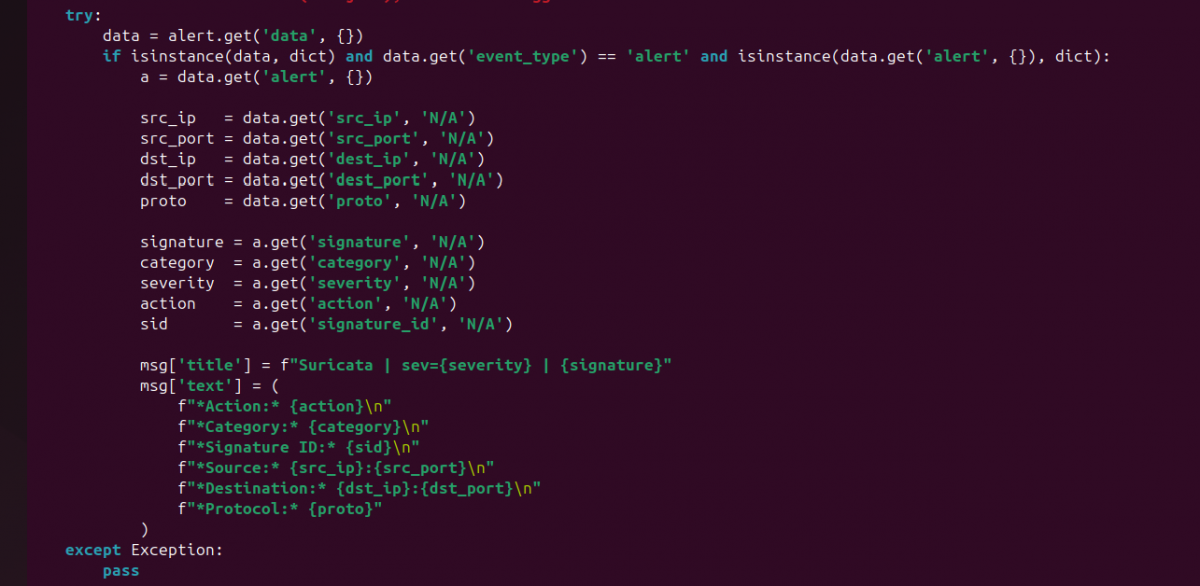
This change turns every Slack alert into something that can be understood in seconds, even on a phone screen.
Before restarting services, I always validate the Python syntax:
sudo /var/ossec/framework/python/bin/python3 -m py_compile /var/ossec/integrations/slack.py
If this command produces no output, the script is syntactically correct.
After restarting the manager, integration activity can be monitored here:
sudo tail -f /var/ossec/logs/integrations.log
At this stage, Slack is no longer a noisy log sink. It is a real SOC alerting channel. Every message is intentional, filtered, readable, and actionable. This is the point where the lab stops being a collection of tools and starts behaving like an operational security environment.
Beyond being a simple notification channel, Slack becomes a real operational component of a SOC when used correctly. It acts as a low-latency decision surface where security signals surface immediately, without the friction of logging into dashboards or querying logs. Future improvements could include channel separation by severity, enrichment with threat intelligence lookups, or automated response triggers tied to specific alerts. Even in a single-analyst lab, Slack forces discipline: alerts must be meaningful, readable, and actionable. That discipline scales. What starts as a personal SOC lab becomes a foundation that can support teams, on-call rotations, and incident response workflows with almost no structural changes.
This is why I decided to integrate Slack into my SOC lab. Even though this is a private lab and the Slack channel has only one member, the purpose is not collaboration. The purpose is signal separation. Slack becomes the place where only events that matter arrive, while everything else stays where it belongs: in logs and dashboards.
Integrating the Slack webhook into the security server (Wazuh → Slack)
The first and most important architectural decision is where the Slack integration lives.
Slack is not integrated into Suricata. It is not integrated on endpoints. The integration happens exclusively on the Wazuh manager.
This is non-negotiable for a clean SOC design.
Wazuh is the component that performs correlation, applies detection logic, evaluates severity, and decides whether an event is worth escalating. Suricata generates signals, but it does not make decisions. Slack must receive decisions, not raw telemetry.
From a technical standpoint, the integration is configured inside the Wazuh main configuration file:
/var/ossec/etc/ossec.conf
Inside this file, I added a dedicated <integration> section to enable Slack notifications:
Each element here has a precise role. Declaring
After saving the configuration, the Wazuh manager must be restarted:
sudo systemctl restart wazuh-manager
To verify that the integration has been loaded correctly, I always monitor the Wazuh logs:
sudo tail -f /var/ossec/logs/ossec.log | grep integratord
A correct setup produces a clear confirmation message indicating that the Slack integration has been enabled.
Before moving forward, however, there is a mandatory validation step that should never be skipped: testing the webhook manually. A simple HTTP POST confirms that Slack is reachable and properly configured:
curl -X POST \
-H 'Content-type: application/json' \
--data '{"text":"Slack webhook test from SOC lab"}' \
https://hooks.slack.com/services/XXXXXXXXX/XXXXXXXXX/XXXXXXXXXXXXXXXX
If this test fails, nothing else will work. Period.
Reducing noise: tuning rules from Suricata to Wazuh
Once Slack integration is active, the next problem becomes immediately apparent: noise.
Suricata is intentionally verbose. It flags informational traffic, benign DNS lookups, update mechanisms, and protocol oddities. This is expected behavior for an IDS, but it is unacceptable for real-time alerting.
The goal is simple: only events that deserve immediate human attention should reach Slack.
Suricata assigns a severity value to each alert:
1 for high severity
2 for medium-high severity
3 for informational events
Wazuh, on the other hand, uses rule levels from 0 to 15. The bridge between these two systems is built inside Wazuh’s local rules file:
/var/ossec/etc/rules/local_rules.xml
Instead of filtering alerts inside Suricata, I let Suricata generate everything and use Wazuh to decide what matters. The strategy is to intercept Suricata alerts using the base Suricata rule (if_sid 86601), inspect the native JSON field data.alert.severity, and promote only severity 1 and 2 events to a high Wazuh rule level.
The custom rules look like this:
This approach creates a clean separation of responsibilities. Severity 3 alerts remain visible in dashboards and logs but never reach Slack. Severity 1 and 2 alerts are elevated, assigned a rule level that exceeds the Slack threshold, and forwarded immediately.
After adding the rules, the manager must be restarted:
sudo systemctl restart wazuh-manager
Rule loading can be verified directly from the logs:
sudo tail -f /var/ossec/logs/ossec.log | grep "rules loaded"
At this point, the alert volume drops dramatically, and Slack becomes quiet. That silence is intentional.
Making Slack alerts human-readable (custom slack.py)
Even with noise under control, there is one final problem: format.
By default, Wazuh sends the full_log field to Slack. Technically complete, operationally useless. Reading raw JSON during an incident is not analysis; it is self-inflicted pain.
The solution is to customize the Slack integration script:
/var/ossec/integrations/slack.py
Inside the generate_msg() method, I replaced the default behavior with logic that extracts only meaningful fields from the Suricata alert payload. Instead of dumping JSON, the script builds a structured, readable message.
The transformation replaces this:
msg['text'] = alert.get('full_log')
with a custom SOC-friendly format:
This change turns every Slack alert into something that can be understood in seconds, even on a phone screen.
Before restarting services, I always validate the Python syntax:
sudo /var/ossec/framework/python/bin/python3 -m py_compile /var/ossec/integrations/slack.py
If this command produces no output, the script is syntactically correct.
After restarting the manager, integration activity can be monitored here:
sudo tail -f /var/ossec/logs/integrations.log
At this stage, Slack is no longer a noisy log sink. It is a real SOC alerting channel. Every message is intentional, filtered, readable, and actionable. This is the point where the lab stops being a collection of tools and starts behaving like an operational security environment.
Beyond being a simple notification channel, Slack becomes a real operational component of a SOC when used correctly. It acts as a low-latency decision surface where security signals surface immediately, without the friction of logging into dashboards or querying logs. Future improvements could include channel separation by severity, enrichment with threat intelligence lookups, or automated response triggers tied to specific alerts. Even in a single-analyst lab, Slack forces discipline: alerts must be meaningful, readable, and actionable. That discipline scales. What starts as a personal SOC lab becomes a foundation that can support teams, on-call rotations, and incident response workflows with almost no structural changes.